I tried to build a service monitor having the following features:
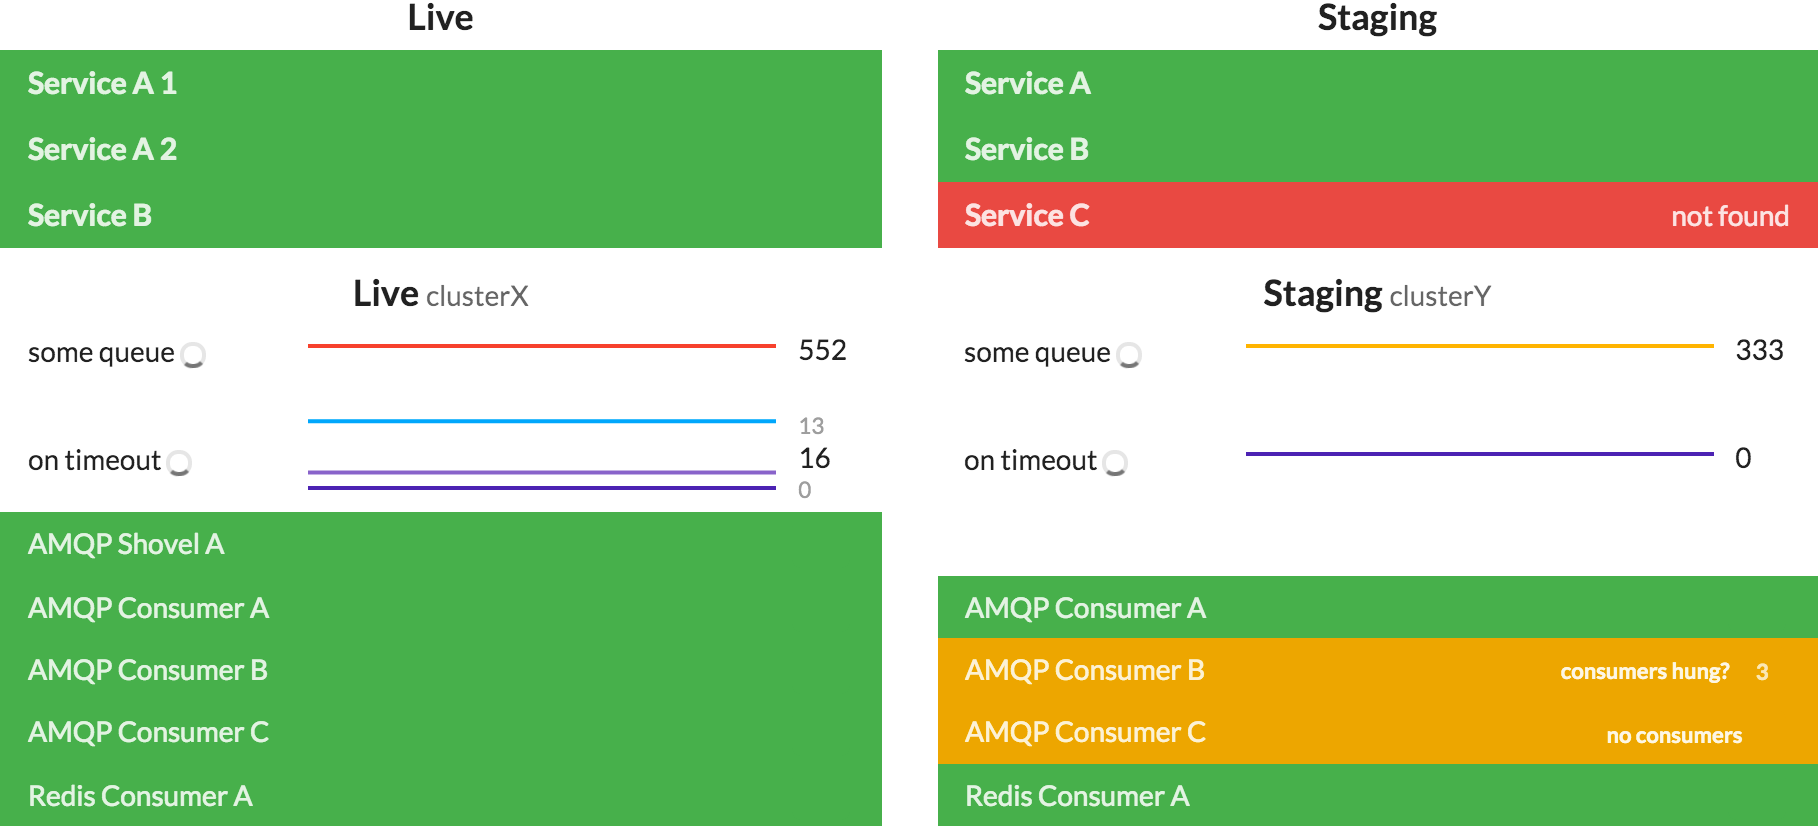
- showing the reachability of HTTP servers
- plotting the amount of messages in a specific RabbitMQ queue
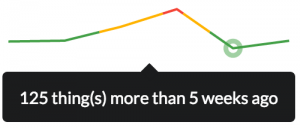
- plotting the amount of queues with specific prefixes
- showing the status of RabbitMQ queues i.e. how many messages are in there? are there any consumers? are they hung?
- showing the availability of certain Redis clients
Well, you can find the result on GitHub.
It uses two things I published before: polymer-flot and flot-sparklines. 😀
An example dashboard: